Introduction
This research note is a walk through of how to use the PLOTS designed spectroscope and the spectral workbench software to determine the concentration of an unknown sample. The procedure requires that you have samples of the same solution of known concentrations. This procedure uses what is commonly called "Beer's Law", which states that the absorbance of a solution is proportional to its concentration. If we have some samples of known concentration, we can use those to determine the concentration of an unknown.
The process is carried out at a specific wavelength which the solution is known to absorb. A green solution (for example the nickel nitrate shown in the main image) is transmitting green light, so green would not be a suitable choice for examining absorbance. The difficulties of choosing different wavelengths to examine absorbance are described later.
Experimental Arrangement
The spectroscope is first calibrated using the normal CFL (mercury) wavelengths. The calibration is then saved. It is important not to alter the spectroscope arrangement once calibration has been done, otherwise the observations will not be comparable..
A broadband light source, such as a halogen lamp, is then used to illuminate the spectroscope. The spectroscope should be arranged so that the colour channels (Red, Green and Blue) are not being saturated. This can be achieved by pointing the spectroscope slightly away from the halogen lamp or, if available, use a dimmer to control the brightness of the lamp. A good, reasonably flat spectrum is desired. The halogen spectrum is then calibrated using the saved CFL calibration.

Simple desktop halogen light (10W) illuminating a sample held in front of the spectroscope
The baseline measurement must now be obtained. This is the transmittance of a sample containing none of the chemical or substance. in other words, a zero percent solution. Distilled water is placed in the cuvette in front of the slit of the spectrometer and the spectrum saved. It is important to use this zero percent solution as the baseline, as it includes any absorbance by the cuvette and the water in the cuvette. Typically, the baseline with have a slightly lower intensity curve than the halogen by itself, although the difference will be very small.

Rudimentary arrangement. Note the small support taped to the underside of the spectroscope, underneath the slit, for holding the cuvettes. I took care not to alter the position of the lamp or the spectroscope once a baseline had been established

The baseline spectrum from the halogen lamp, passing through the cuvette filled with distilled water.
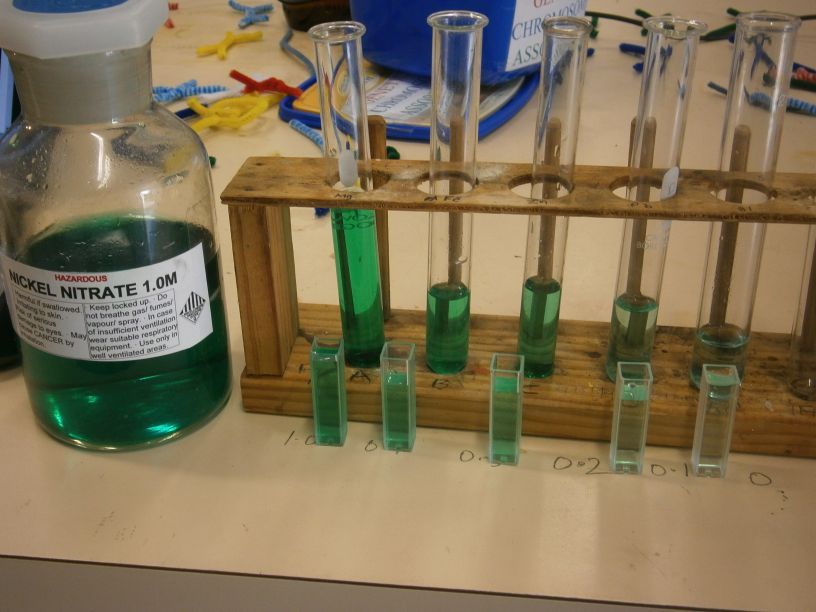
Solutions of the sample you wish to analyse are now examined. For the purposes of this research note, I used 5 (nickel nitrate) and 6 (red food colouring) samples in order to demonstrate the Beer's Law relationship. These samples have a known concentration, whether this is a relative concentration or an absolute concentration is dependent on the purposes of the investigation. In my case, I used a known concentration of 1.0M nickel nitrate and an approximate mixture of red food colouring which I designated "full dose" or the 1.0 mix.

Nickel nitrate solutons (0.1, 0.3, 0.5, 0.7 and 1M) and the red food colouring solutions
Each sample is placed in the cuvette (after appropriate rinsing procedures) and the spectrum recorded. It is vital that the spectroscope and halogen arrangement is not disturbed, any changes in the intensity of the light being recorded that are due to alterations will invalidate the experiment. The intensity of the spectra should reduce as a result of the solution and nothing else.

The cuvette, holding a 0.7M solution of nickel nitrate. The cuvettes are laboratory grade plastic which are relatively cheap. They have two plain sides and two sides with corrugations. In use, the cuvette is held by the corrugated sides and light passed through the smooth or plain sides. Care is usually taken to ensure fingerprints are not left on the cuvette. It would be possible to use an alternate arrangement, such as a square glass bottle for measuring the spectra, but it is important that the light passes through the same depth of solution in order to be able to compare readings.
Save each spectra and calibrate it against the same CFL calibration used at the start of the experiment.
Selecting the Abosrbance Wavelength
The wavelength for measuring the absorbance must now be selected. A suitable wavelength should show a good reduction in intensity across the range of concentrations being measured. This is not always easy, but generally the absorbance wavelength will not be the same colour as the solution. It is useful to examine the spectra to select a suitable wavelength.
This can be done simply by adding your captured spectra to a set. Use the first (baseline) spectra to create a set and note the identity of the set from the http address. Then go through and add the other spectra of the samples to this set identifier in spectral workbench.
Spectral workbench will now display all of the spectra in the set overlaid on the same graph. I have taken a similar graph from a spreadsheet to show the intensity curves.

This looks confusing, but it is showing the intensity of the light transmitted by the samples across the whole spectrum, in this case I have cropped the graph to show between 460 and 640nm, as this is the useful visible light region. You will note that the curves get progressively lower as the concentration increases. This graph also shows the CFL calibration spectra for completeness, it is the spiked curve with peaks at the mercury lines.
Usually, only two solutions of known concentration are tested in order to determine the linear relationship between absorbance and concentration. In this experiment several known samples were tested, so the graph looks rather cluttered.
An observation of the graph suggests that a good spread of absorbance is occurring around 600 to 625 nm. So a wavelength in this range is selected. I have chosen 600nm
It is possible to use spectral workbench to determine the aborbance by hovering the mouse on the appropriate wavelength and reading the intensity. The absorbance is calculated by subtracting the intensity of the sample from the intensity of the baseline.
I chose to calculate absorbance by downloading the spectra in CSV format and selecting the values manually. I then had a spreadsheet calculate the absorbance values:
Intensity and absorbance at wavelength 600.597 nm

This data produced the following graph:

The graph is remarkably linear and supports Beer's Law nicely.
Selecting other wavelengths produced the following graphs:

625 nm absorbance

580nm aborbance
The 580nm absorbance graph is not as useful as the 600nm or 620nm graphs as there is less absorbance at this wavelength and errors in the intensity will create large amounts of scatter. This illustrates the importance of selecting a good wavelength.
Red Food Colouring Data
The red food colouring data displays two additional problems which are worth noting:

absorbance graph at 590nm. Above 0.5 concentration, the solution is absorbing almost all of the light at 590nm, so flatlines. This is obviously not useful for trying to analyse concentrations above 0.5.

at 600nm, Absorbance is greater and a wider range of concentrations can be analysed.
Since the food colouring is allowing red light through, moving into the red region of the spectrum is getting closer to the transmittance of the food colouring and this effect is shown below.

At 620nm, we are into the red area and the absorbance is quite low.

visually it looks like this, at 0.1 concentration shown above, the bandwidth is quite wide, but centered in the red.

at 0.5 concentration, shown above, the food colouring is transmitting only the red component.
Determining the Concentration of an Unknown Sample
Once the linear Beer's Law relationship has been established, it is a simple matter to measure the absorbance of a solution at the same wavelength and interpolate the graph.
There are however some constraints to what is possible. The unknown solution must the same chemical as the samples that were used to establish the calibration. It is not possible, for example, to determine the concentration of red food colouring from the nickel nitrate concentration vs absorbance line.
Discussion
This was my first attempt at extracting absorbance and concentration data experimentally. I ran into problems using the online capture interface for spectral workbench and had to work around the calibration issues by working with the csv files directly. This is not as difficult as it might appear and allows the spreadsheet to do all of the hard work.
My spectra sets can be found here:
https://spectralworkbench.org/sets/show/401 (nickel nitrate)
https://spectralworkbench.org/sets/show/402 (red food colouring)
The spectral workbench hiccups can be seen in the inverted wavelength axes for some, but not all of the data. This problem has subsequently been resolved.
My data is also very noisy, with lots of spikes and other anomalies. This is possibly because I didn't conduct the readings in darkness, but left the flouro lights on ! This was evident as the noise at the CFL wavelengths which have possibly entered the spectroscope, sneaking in behind he cuvette as the CFLs were overhead.
I should also stress that my spectroscope is fairly basic, Uses a $5 webcam and the slit arrangement has not been finessed for resolution.
It is important not to over saturate the camera and to disable any automatic white balance or exposure features your camera might have.
This analysis has shown me that if wavelengths are chosen judiciously, the PLOTS spectroscope and spectral workbench are excellent tools for concentration measurements. I have compared the results to that obtained with other apparatus designed to be used in an educational setting and found similar amounts of random errors. There are educational benefits to using spectral workbench and manually extracting the data and the concept of absorbance is highlighted using this method.

quick and easy arrangement on the front bench of my science classroom. I would tie everything down a bit more securely for serious work !
stu
14 Comments
This is fantastic to see carried out so methodically.
Reply to this comment...
Log in to comment
what software do you use for your analisis program used to generated graph?
Is this a question? Click here to post it to the Questions page.
Reply to this comment...
Log in to comment
Thanks for the question ichinarayan,
I exported the spectra in csv form into microsoft excel. From there I selected the wavelengths I wanted to study and subtracted the intensity of the sample from the intensity of the baseline, giving "absorbance". Simple then to plot the results on a scattergraph in excel.
hope this helps
stu
Reply to this comment...
Log in to comment
wow beyond belief. i thought it was complicated listing program. and
how do you exported the spectra image into csv form?
thanks a lot
Is this a question? Click here to post it to the Questions page.
Reply to this comment...
Log in to comment
In spectral workbench, when you are looking at a spectra, there is an option to export and save the data in a variety of formats, including xml and csv. csv is easy as it can be imported directly into the spreadsheet.
Reply to this comment...
Log in to comment
ok thanks so much
Reply to this comment...
Log in to comment
I'm new to the cellphone-becomes-a-photospec phenomenon, as I was told about this by a colleague. As an AP Chem teacher, I'm looking for hacks to do this instead of buying a bunch of spectrophotometers (which are expensive). Is this something you were able to have students replicate? My students have smart phones and can get Google Chrome on it, but I'm concerned about the data-noise and getting lost in the technology instead of focusing on the chemistry. Ideas?
Is this a question? Click here to post it to the Questions page.
Reply to this comment...
Log in to comment
Good points and I understand how you feel, coming at his from a chemistry teachers viewpoint myself. I guess it depends on what experiments and demonstrations you wish to carry out. As a simple demo, to observe the mercury lines in a CFL discharge, it is simple and very powerful for students. Little technology is required and some excellent chemistry principles. Simple step then to looking at other discharge lines, say using discharge tubes common in most classrooms or looking at flame spectrography.
A few resources, my intro vid to using the spectroscope in the lab with students: https://www.youtube.com/watch?v=_j0sAD11x_0 (a bit cheesy, but gives you an idea)
my presentation at a Science teachers conference: http://www.slideshare.net/moelfre/plots-spectroscope-sasta-presentation-2013 which runs through setting up a scope
Now that smartphones and the portable spectrometer are available through public lab, they might be a simple way to get a whole class engaged quickly.
If you wanted to run the Beer's law experiment, as it stands with the current spectral workbench capture software, you will have a bit of IT to wade through, which is unavoidable.
Compared to buying a datalogger ($800), spectrovis ($800) and the software to run it ($300) for under $10 you can build one (with the students, maybe a year 9 class) and at that price, they are almost disposable.! It is indeed a quick and very nifty hack !
good luck, where abouts are you ?
stu
Is this a question? Click here to post it to the Questions page.
Reply to this comment...
Log in to comment
I need to measure oil concentration in a water mixture. Can a SPECTROMETER be used to measure the oil concentration? If it a solute that dissolves then SPECTROMETER helps. What about oil & water mixture? Thanks in advance.
Is this a question? Click here to post it to the Questions page.
Reply to this comment...
Log in to comment
Quick question, I'm trying to do something similar for a school project. Shouldn't the absorbance of the sample be the negative log of the percent transmittance? That is A = -log(I/Io). In your test you used A = I - Io, though your curves look very linear. Do you have any insight on this? Thanks.
Is this a question? Click here to post it to the Questions page.
Reply to this comment...
Log in to comment
Thanks for the question. My apologies that all of the graphs appear to have vanished (they have for me). Not sure why, maybe a hosting issue.
Anyway, I am not sure about the -log(I/io) relationship. I simply used the difference between the baseline and the sample as a measure of absorbance (A=I-Io) at particular wavelengths as you deduced, and then simply converted this to a percentage absorbance. Then plotting absorbance vs concentration, obtained the linear (Beer's Law) graphs. My understanding of Beer's Law is that absorbance is directly proportional to concentration.
I am not a chemistry major, so I am not sure about the -log(I/Io) relationship. I would be interested in learning more about this ! Sorry I can't help any further.
Reply to this comment...
Log in to comment
It's odd -- I see the graphs. Straylight, can you contact web@publiclab.org so we can figure out what's going on there?
Is this a question? Click here to post it to the Questions page.
Reply to this comment...
Log in to comment
Yes the Beer-Lambert Law is based on -log(I/Io) but it's applicable for a single wavelength value. (https://en.wikipedia.org/wiki/Beer%E2%80%93Lambert_law) And this law has many limitations. Recent research showed that the area under the peak is much more stable indication of concentration variations (http://www.hindawi.com/journals/jspec/2013/919023/). Hope this is helpful...
Reply to this comment...
Log in to comment
thanks ygzstc, that makes sense. I think that the approximation that relative intensity measured from the scope can be used in place of the log relationship and is accurate enough. It begs the question how the camera (and software) are determining intensity...voltage across a CCD cell in the camera ? emphasis on the green (twice as many green cells as R and B. If intensity is on a logarithmic scale like sound, which depends on how it is being measured, then yeah, I get the decibel arrangement.
I like the idea that we work with a finite area under a peak, actually integrate an absorbance, but again, I think for a year 12 (senior) chem class, that is a step further.
thanks Jeff, I suspect the problem with images loading might be at my end. The blobs only appear for the spreadsheets, I can still see the jpegs. which suggests my browser is at fault. Good to know the ss can still be seen by everyone else, thanks for spotting this.
Is this a question? Click here to post it to the Questions page.
Reply to this comment...
Log in to comment
Login to comment.