What I want to do
Based on the difficulties @mathew highlighted in his research note yesterday, I spent today developing a smoothing system (using the Spectral Workbench API: https://spectralworkbench.org/macro/warren/smooth_save) which:
- saves its "smoothed" version of the data, so it can be compared in sets
- tags the spectra with "smoothed:1+10" where the sampling row is 1 and we average in 10 additional rows below it
I also created, at @mathew's suggestion, a "equalize height" comparison tool (https://spectralworkbench.org/macro/warren/equalize-height) for sets, since in some cases that may be more useful than the existing "equalize area" (https://spectralworkbench.org/macro/warren/equalize_area).
My attempt and results
I've worked solely with the data @mathew collected in his note, so far. I'm writing this as I work, but a simple initial comparison of unsmoothed vs. smoothed data can be seen with these two sets:
- unsmoothed: https://spectralworkbench.org/sets/show/1475
- smoothed: https://spectralworkbench.org/sets/show/1483


I've also run "equalize height" from the "More tools" menu to ease the comparison.
Next, I'm going to try it with a larger set, which includes samples of North Dakota crude oil and a variety of motor oils @mathew tested with the same webcam we use for the Infragram Webcam -- albeit without the blue or red filter: https://spectralworkbench.org/sets/show/1481
For each spectrum in that set, I:
- made a copy
- checked for overexposure or clipping by looking for a flat-topped peak in RGB mode
- if overexposed, selected a new cross section that was not
- copied the calibration from this CFL spectrum
- ran the new "Auto smooth 10 rows below" tool which just runs my macro (link above)
I then added all of them into a new set:

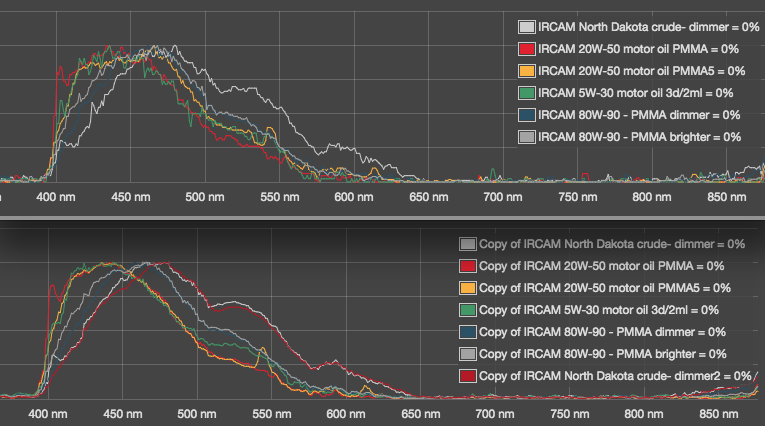
Compare this with this collection, which is also height-equalized, but not smoothed:

The unsmoothed set has too much noise to infer much, although one does make out two "humps" -- one in the 520-580nm range and another in the 580-600nm range. But the smoothed version not only shows those much more clearly, it also shows how closely the two North Dakota crude samples align.
I think we can also see the 20W-50s aligning, and with them the 5W-30 until it diverges above 500nm. The 80W-90s also seem to be reasonably aligned.
The highest points of each type also seem to be occasionally different, although the 80W-90 and the crude are probably not distinguishable just on peak position -- but the secondary "hump" at 575 seems to make the crude stand out quite a bit.
Questions and next steps
What are these "humps"? I theorize that although they're reproducible with a single camera/device, the actual hump shape is from the recombining of the RGB data from the camera's 3 color channels. You can see that the crude spectra's RGB data, when separated out, show matching peaks -- when combined, you get humps:

The motor oils don't show that as much:

However, although the humps themselves may be artifacts, they may be a consistent way to compare oils -- for the time being just on the same camera/spectrometer. I could imagine shipping heavier and lighter oils to "bracket" an unknown sample. Or, we could focus on peak position -- I do wonder if we don't mix channels at all, if the blue channel alone could be a more reliable measure of peak position.
Finally, we really need to help people watch out for clipping/overexposure. I think there should be an automatic indicator of where clipping is occurring on ANY saved spectrum. Maybe it could offer to help you identify a dimmer row where clipping isn't happening. Data like the below is not useful for comparison since the brightness is too high for the camera, flattening the top of the graph, but it's not very apparent until you go to RGB mode:

2 Comments
OK, I added a couple more features -- one which bisects a graph with a vertical line where the area of the graph is equally divided -- what's that actually called? Anyhow I've just labelled it "Find graph 'centers'":
I also made a "Crop view" feature so you can zoom in a bit. It kind of sucks so maybe I'll add a real zoom feature and let people scroll back and forth. But it's too late tonight. But this makes it much easier to see the sequence of heavy/light oils:
https://spectralworkbench.org/sets/show/1482, of the SYBA cam:
https://spectralworkbench.org/sets/show/1484, of the filterless Infragram Webcam:
And https://spectralworkbench.org/sets/show/1481, of the filterless Infragram Webcam:
Is this a question? Click here to post it to the Questions page.
Reply to this comment...
Log in to comment
Unfortunately some of these lines are covered by others. I guess I should make the key show a wavelength too?
Is this a question? Click here to post it to the Questions page.
Reply to this comment...
Log in to comment
Login to comment.